Anatomy of a Transformation - 25 Years’ Evolution in Enterprise Data Architecture (2000-2025)
This analysis traces a twenty-five-year transformation in enterprise data architecture through two complementary lenses: The horizontal lens examines nine dimensions—uses & requirements, processes, functions, applications, techniques, operations, culture, governance, and strategy. It highlights the distinct trajectory of each, the asynchronies in their evolution, and the interdependencies that structure the overall transformation. The vertical lens illuminates three pivotal shifts, moments where several dimensions changed simultaneously due to specific triggers: data specialization (2005–2010), organizational hybridization (2012–2018), and the rise of data-native architectures (2018–2025). Together, these lenses reveal that the transformation did not occur linearly, but in successive waves. They provide an understanding of both the inherent dynamics of each dimension and the system-wide effects that accelerated or constrained the change. This dual perspective is essential for anticipating emerging tensions and guiding future strategies. This framework serves as both an operational tool for practitioners and a pedagogical model for teaching: For executives and CDOs, it offers a method for diagnosing organizational maturity and anticipating challenges, enabling them to orchestrate the transformation by accounting for interdependencies. For educators and students, it provides a systemic approach that moves beyond purely technical views to embrace the full organizational complexity of data-driven change, offering an analytical framework applicable to any industry.
Charles Ngando Black
11/11/202516 min temps de lecture


Executive Summary
This analysis traces a twenty-five-year transformation in enterprise data architecture through two complementary lenses:
The horizontal lens examines nine dimensions—uses & requirements, processes, functions, applications, techniques, operations, culture, governance, and strategy. It highlights the distinct trajectory of each, the asynchronies in their evolution, and the interdependencies that structure the overall transformation.
The vertical lens illuminates three pivotal shifts, moments where several dimensions changed simultaneously due to specific triggers: data specialization (2005–2010), organizational hybridization (2012–2018), and the rise of data-native architectures (2018–2025).
Together, these lenses reveal that the transformation did not occur linearly, but in successive waves. They provide an understanding of both the inherent dynamics of each dimension and the system-wide effects that accelerated or constrained the change. This dual perspective is essential for anticipating emerging tensions and guiding future strategies.
This framework serves as both an operational tool for practitioners and a pedagogical model for teaching: For executives and CDOs, it offers a method for diagnosing organizational maturity and anticipating challenges, enabling them to orchestrate the transformation by accounting for interdependencies. For educators and students, it provides a systemic approach that moves beyond purely technical views to embrace the full organizational complexity of data-driven change, offering an analytical framework applicable to any industry.
Introduction
Over the past twenty-five years, Enterprise Data Architecture has undergone a radical transformation, evolving from a set of peripheral tools and processes into a central, strategic foundation for organizations. This systemic shift did not happen linearly but in successive waves, with each dimension evolving on its own timeline while influencing the others. This analysis is based on observed sector trends and testimonies from key actors. Projections for 2020-2025 extrapolate from emerging signals that will be confirmed by ongoing developments.
Horizontal Lens - The Nine Dimensions of Transformation
The first lens examines the evolution of nine core dimensions of the data ecosystem: uses and requirements, organizational processes, functions and roles, applications, technical architectures, operational models, culture, governance, and strategic planning.
This horizontal view reveals that each dimension follows its own temporal trajectory, creating asynchronies that are sources of both innovation and tension. A granular analysis of these parallel evolutions illuminates the dynamics of interdependence: how maturing governance catalyzes sophisticated strategies, how technical empowerment enables new operational models, and how the structuring of functions legitimizes new processes.
This dimension-by-dimension analysis forms the necessary foundation for identifying the inflection points, discussed in the next section, where multiple dimensions shift simultaneously under the influence of specific triggers.
Uses and Requirements
The transformation of data architecture is not primarily the result of an internal choice, but a consequence of multiple external pressures that, over time, strained the traditional binary IT-business model. These pressures manifest as new use cases and escalating requirements that collectively make the emergence of a third pillar—Data—inevitable.
2000–2005: Silos and First Signals
Regulatory requirements emerged in the early 2000s. The Sarbanes-Oxley Act (2002) mandated financial data traceability, while Basel II (2004–2006) required European banks to consolidate and ensure the reliability of their risk reporting.
In the banking sector, Sarbanes-Oxley compliance revealed teams' inability to quickly justify the origin of financial figures. A 2004 PwC study found that 78% of Fortune 500 companies had to recruit dedicated teams for data traceability, with compliance costs averaging 0.06% of revenue.
In retail, newly deployed ERPs automated internal processes effectively but could not provide a consolidated customer view across business silos. The same customer might be managed differently depending on whether they purchased in-store, online, or via customer service, with no means of automatic reconciliation.
2005–2010: Regulatory Tensions and Consolidation
Technological requirements kept pace with innovation: the web and e-commerce explosion, and the initial shift to service-oriented architectures. This period saw growing tension between the rigidity of legacy systems and the need to integrate increasingly heterogeneous data flows.
In European banks, Basel II required aggregating credit, market, and operational risk data—historically managed by separate teams. Reconciliations were manual, done in Excel, generating high operational costs and significant error risks during quarterly closings.
In manufacturing, early attempts at product traceability, especially in the food industry after health crises, revealed a lack of shared reference data between supply chain and quality teams. Reconstructing a product's history required manually consulting multiple business systems with no guarantee of temporal consistency.
2010–2015: Emergence of Data Roles
Business requirements began to demand cross-functional integration: a 360° customer view, connected supply chain segments, real-time performance management, and event anticipation through predictive models.
In insurance, Solvency II pushed organizations to create specialized risk data management functions. The emergence of dedicated Data Quality teams marked the first recognition of data as a full-fledged domain of expertise, requiring skills distinct from traditional IT or actuarial roles.
In e-commerce, the explosion of web and mobile data generated unprecedented volume and variety. This led to the first Data Labs: hybrid teams of data scientists, business analysts, and developers leveraging new behavioral data streams for real-time optimization.
2015–2020: Explicit Governance and Cultural Shift
Societal and cultural requirements gained prominence: growing customer and citizen expectations for transparency, the rising importance of digital trust as a competitive factor, and the need to balance data exploitation with protection.
In the public sector, the GDPR (2018) mandated the appointment of Data Protection Officers (DPOs) and formalized personal data protection processes. The French Association of Data Protection Officers (AFCDP) counted 25,000 declared DPOs in France by end-2019, up from fewer than 500 IT and privacy correspondents in 2017, marking the large-scale creation of a new function.
In healthcare, the gradual integration of patient data via electronic medical records required forming mixed teams of Data specialists, IT staff, and clinicians. These hybrid teams developed a common language and shared validation processes, foreshadowing the collaborative models that would become standard in the following decade.
2020–2025: Systemic Integration and AI
In telecoms, using real-time data for AI-driven fraud detection and churn prediction requires integrated Data supervision capable of managing production algorithms 24/7. Traditional operational teams are acquiring data skills to oversee predictive models embedded directly into customer journeys.
In transport and logistics, developing predictive supply chains with IoT and AI demands data-centric processes, hybrid cloud/edge platforms, and a shared culture where every actor understands the impact of their data quality on the entire system.
Thus, uses and requirements are not peripheral; they are the primary engine of transformation. By exposing the shortcomings of the binary model and forcing organizations to demonstrate, secure, share, and valorize their data, they necessitate the architectural restructuring that elevates Data to the same level as IT and the business.
Organizational Processes: From Binary Silos to Data-Centric Orchestration
In the early 2000s, data processes were characterized by a stark binary separation between business and IT. Business users formulated needs in natural language, often informally, and passed requests to technical teams who interpreted them. This successive translation created inevitable distortions between what was requested and what was delivered.
The first shift began around 2005-2007, driven by increasingly sophisticated analytical needs. Companies built point-to-point bridges: business analysts to mediate between worlds, more structured specification workshops, and rapid prototyping to validate mutual understanding. These bridges remained ad-hoc, project-by-project solutions.
The real transformation occurred between 2010 and 2015 with the emergence of cross-functional sharing. Data processes evolved from isolated corridors into shared workflows, orchestrated by dedicated centers of excellence. This era saw the birth of standardized data governance processes, quality validation circuits, and self-service provisioning. The key innovation was treating data needs as a distinct domain of expertise.
Since 2018, a deeper revolution has unfolded: the rise of data-centric processes. Data is no longer a byproduct but the backbone of business processes. Organizations now redesign workflows treating data as a strategic asset, integrating quality, traceability, and reusability from the outset. This data-centric logic is transforming how products and services are conceived.
The Function Ecosystem: From Artisanal Dispersion to Collaborative Orchestration
In 2000, the concept of a "data function" was incongruous. Skills were scattered: statisticians in marketing, IT staff in IS departments, management controllers in finance. Each handled "their" data with their own tools and standards—a form of local craftsmanship effective in isolation but impossible to industrialize.
The evolution began with the emergence of specialized roles around 2006-2008. Data analysts were the first to crystallize this specialization, followed by data quality managers. These roles often remained within traditional business or IT departments but began developing a common language, shared methods, and a distinct professional identity.
The decisive turn came between 2012 and 2016 with the rise of an ecosystem of specialized management functions. Chief Data Officers played a visible role, but they were just one piece of a complex puzzle. Simultaneously, Chief Analytics Officers, Chief Information Security Officers, and (with GDPR) Data Protection Officers became essential actors in data governance. This period revealed the need to orchestrate these functions rather than centralize them under a single authority.
Today, we see a mature ecosystem of interdependent data functions. Each develops its own specialized processes: the DPO structures GDPR compliance workflows, the CISO deploys data classification tools, the CAO pilots analytics platforms. The innovation lies in their growing ability to orchestrate cross-functional processes: shared governance of reference data, cross-validation circuits, and multifunctional steering committees. This collaborative maturation is turning data literacy from a technical skill into a distributed organizational competency.
Application Evolution: From Artisanal Solutions to Integrated Ecosystems
The history of data applications began with a proliferation of ad-hoc solutions. Every department and project team built its own tools: custom Excel extracts, hand-crafted SQL queries, and homegrown dashboards. This "local" logic was highly creative but spawned unmanageable complexity and major consistency risks.
The first wave of industrialization (2005-2009) focused on control. Companies deployed data quality solutions, master data repositories, and standardized ETL tools. The goal was to secure and stabilize the existing environment, a defensive but necessary step towards robustness.
The shift to multi-domain co-construction occurred between 2012 and 2017. Data applications ceased to be designed in silos and became cross-functional projects, involving business users from the outset. This era saw agile methodologies, co-design workshops, and "design thinking" applied to analytical solutions. The innovation was the ability to converge heterogeneous business needs into coherent technical solutions.
Since 2018, the evolution has been toward integrated platforms that revolutionize the concept of data applications. These platforms do more than orchestrate disparate tools; they provide unified environments where data flows seamlessly from one use case to another. Business users can explore, analyze, model, and share within a fluid technological continuum, without context switching or experience breaks.
Technical Architectures: From IT Hegemony to Data-Native Platforms
In 2000, IT held absolute sovereignty over the technical data universe. Choices of formats, storage, and architecture were dictated by IT constraints and standards. Data was modeled to fit available technical capabilities, and users had to adapt. This "IT-centric" logic ensured technical coherence at the cost of business frustration.
The emergence of dedicated data building blocks (2007-2011) marked the first signs of emancipation. Business intelligence solutions, specialized data warehouses, and visualization tools began developing their own technical standards. This period introduced a "technical duality": transactional systems remained under traditional IT, while analytical systems developed their own paradigms.
The decisive break came between 2015 and 2018 with the clear separation of IT platforms and Data platforms. This was not a divorce but a conscious specialization. Data platforms developed their own cloud-native architectures, distributed processing paradigms, and security standards. They ceased to be extensions of IT systems and became autonomous technical ecosystems.
Today, this technical autonomy is radicalized with the emergence of "data platforms" that redefine industry standards. These platforms natively integrate artificial intelligence, real-time processing, and cloud elasticity. They transcend traditional storage and delivery functions to offer continuous data enrichment, augmentation, and contextualization. This fundamental evolution transforms data from a passive asset into a dynamic, self-optimizing capital.
Operational Models: From Reactive Firefighting to Predictive Intelligence
Data operations long functioned on a purely corrective logic. When a quality issue was detected, a dashboard showed inconsistencies, or a user reported an anomaly, teams would intervene after the fact. This reactive approach, dominant until 2008-2010, created a perpetual "firefighting" culture where urgency dictated priorities.
The transition to preventive measures began with the deployment of automated controls around 2010-2014. Organizations instrumented their processing chains with quality probes, automatic alerts, and supervision dashboards. This preventive logic allowed them to anticipate problems before they impacted end-users, gradually shifting the operational posture from repair to prevention.
The next step, shared supervision, developed between 2015 and 2019. Data operations became a shared concern with the business, not just a technical team responsibility. Data stewards, data product owners, and power users were integrated into operational monitoring. This democratization of supervision created a finer, more contextualized network of vigilance.
Since 2020, we have entered the era of intelligent anticipation. Operational systems now incorporate predictive capabilities to anticipate failures, optimize performance, and auto-tune parameters. AI applied to data operations transforms passive monitoring into proactive management. Systems learn from historical patterns to predict and prevent incidents before they occur, reducing downtime by an average of 25% in mature organizations (Gartner).
Culture: From Distrust to Shared Responsibility
Culture is often the invisible yet critical variable in transformation. Initially, data was treated as a purely technical object: the business used it without responsibility, IT controlled it, and mutual distrust prevailed.
Gradually, regulatory constraints and new uses imposed a minimal cultural shift. This remained fragmented for years, with a few quality managers, analysts, or risk managers acting as isolated "pioneers" without a collective framework.
The 2010s marked a turning point with institutionalized awareness programs and the rise of cross-functional roles (DPO, CISO, CDO) that made shared responsibility explicit.
Between 2015 and 2020, this movement expanded: data became embedded in committees, training, and managerial practices, becoming a component of organizational culture. Since 2020, data literacy has solidified as a strategic competency, integrated into corporate frameworks, HR development paths, and operational reflexes.
This dynamic explains the observed asynchronies: an organization can invest heavily in technology or create new functions but remain stalled if its collective behaviors, implicit beliefs, and daily practices don't evolve in parallel. Cultural transformation is not just parallel to but constitutive of data architecture transformation.
Data Governance: From Organized Anarchy to Regulated Ecosystems
Data governance was virtually non-existent in the early 2000s. This wasn't an oversight but a reflection of data's peripheral status. Data was seen as a byproduct of business processes, needing no specific governance beyond standard IT backup and security rules.
The first structuring phase (2006-2010) imposed IT rules on data issues. IT departments extended their traditional governance—technical committees, security standards, change procedures—to data. This "IT-imposed" approach brought rigor but was often disconnected from business-specific data concerns.
The shift to shared tactical committees occurred between 2012 and 2017. This period saw the first data committees that brought business and IT representatives together around concrete issues: defining reference data, arbitrating quality disputes, prioritizing developments. These mixed forums created a common language and shared decision-making, transforming governance from a technical exercise into a strategic imperative.
Since 2018, evolution has trended toward multi-level governance reflecting data's growing complexity. This model articulates strategic instances (executive data committees), tactical ones (data product committees), and operational ones (communities of data stewards). Each level has its own responsibilities, timelines, and operating modes. This layered architecture allows simultaneous addressing of strategic vision, operational management, and technical execution.
More profoundly, this multi-level governance signifies the recognition of data as a full-fledged strategic asset, requiring management frameworks as sophisticated as those for other critical corporate assets.
Strategic Planning: From Non-Existence to Data-Native Vision
In the early 2000s, there was literally no dedicated strategic planning for data. This absence reflected reality: data was perceived as a means, never an end. It appeared in strategic plans only as support for business objectives, never as an autonomous strategic axis. Data budgets were buried within IT or business lines, lacking specific visibility or management.
The first emergence of strategic data consciousness appeared around 2007-2010 with the integration of data objectives into IT strategies. IT departments began including "Business Intelligence" sections in multi-year plans, specifically budgeting data projects, and defining dedicated technology roadmaps. This approach was still technical but marked the first recognition of data's specificity in corporate planning.
The decisive shift occurred between 2012 and 2017 with the rise of cross-functional data strategies. Companies began developing "data strategies" that transcended organizational silos. For the first time, these strategies articulated business vision and technical means around explicit data objectives: improving customer knowledge, operational optimization through data, developing new data-driven services. This era saw the first CDOs, whose primary mission was to champion this cross-functional strategic vision.
Since 2018, we witness the emergence of integrated data strategies that place data at the heart of business transformation. These strategies no longer just define data objectives; they redefine the business model itself around data capabilities. Planning becomes "data-native": new products are designed as data products, business processes are rethought to maximize the value of generated data, and strategic partnerships systematically include a data exchange dimension.
This evolution in strategic planning completes a transformation cycle, moving data from the status of a technical byproduct to that of a central strategic capital in value creation.
Synthesis and Vertical Lens - The Systemic Dynamics of Transformation
The detailed horizontal analysis allows us to synthesize the common dynamics across all dimensions and identify moments of systemic rupture where the transformation accelerated globally.
This synthesis first reveals recurring patterns: the shift from siloed to integrated approaches, the progressive emergence of data autonomy from traditional IT, and the rise of collaboration and cross-functionality. These convergent trends outline a genuine organizational revolution.
Beyond these common patterns, the vertical analysis highlights three temporal breaks where these evolutions crystallized simultaneously: data specialization (2005-2010), organizational hybridization (2012-2018), and the advent of data-native architectures (2018-2025). These pivotal moments represent systemic shifts where specific triggers prompted a global recomposition of the ecosystem.
This dual reading—synthesizing cross-cutting patterns and identifying temporal ruptures—forms the foundation for a systemic understanding of the transformation and paves the way for analyzing future challenges.
Temporal Mapping: Twenty-Five Years of Asynchronous Evolution
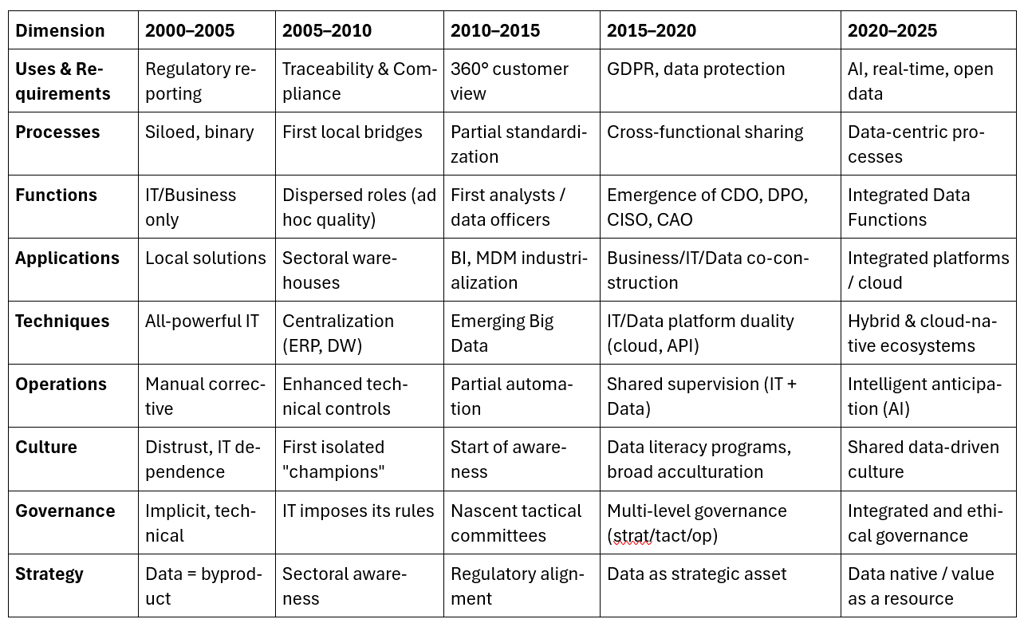
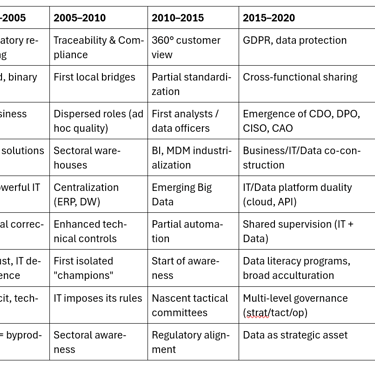
The summary table reveals three fundamental dynamics structuring the systemic transformation of data architecture.
Summary Table: The Dimensions of Transformation
Progressive Temporal Acceleration
Longitudinal analysis shows a transformation pace that gradually intensified. The 2000-2010 periods were reactive and fragmented: constrained regulatory reporting, point-to-point technical fixes, uncoordinated roles. Acceleration became notable from 2010-2015, turning proactive with process standardization and BI industrialization. The 2015-2020 period confirmed this trend with multi-level governance and explicit data strategies. Finally, 2020-2025 culminates in systemic maturity, with all dimensions converging toward integration.
Structuring Asynchronies
Time lags between dimensions reveal different evolutionary logics. The technical dimension evolved rapidly (ERP/DW by 2005, Big Data by 2010, IT/Data duality by 2015), driven by innovation. The cultural dimension showed a structural delay (distrust until 2005, maturity only by 2020-2025) due to the deep-seated nature of behavioral change. Organizational dimensions followed an intermediate pace, balancing technical innovation with cultural realities.
Distinct Maturation Trajectories
Each dimension followed its own logic: uses evolved by accumulation (new waves adding to old), processes through progressive de-siloing, and strategy via a radical shift (from "byproduct" to "native value"). This diversity of paths explains the complexity of the overall transformation.
The 2020-2025 analysis reveals a striking convergence toward systemic integration: all dimensions incorporate cross-functionality, intelligence, and ethics, demonstrating mature orchestration rather than mere standardization.
Vertical Lens: Systemic Ruptures
The dimensional view captures the specific trajectory of each component. But to understand the overall logic, we must add a vertical lens that reveals moments where multiple dimensions shifted simultaneously due to specific triggers.
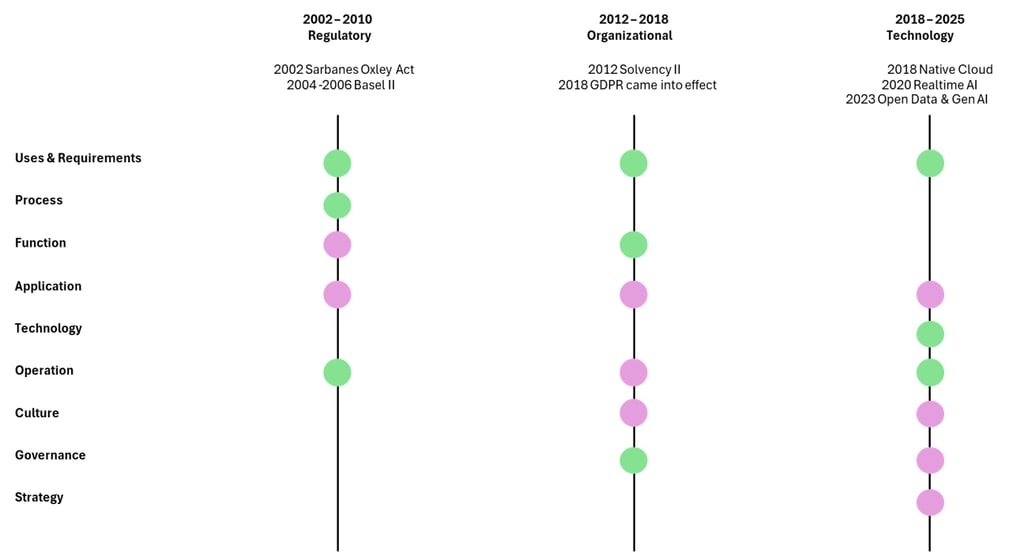
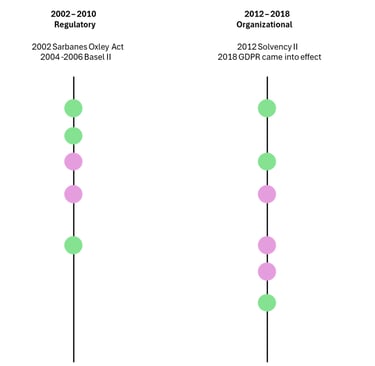
Temporal Ruptures and Domino Effects in Data Architecture (2002 - 2025)
This diagram highlights that the transformation is not just explained by each dimension's evolution but also by cross-cutting ruptures triggered by specific events.
2002–2010 (Regulatory): The Sarbanes-Oxley Act (2002) and Basel II (2004–2006) imposed new traceability and consolidation rules. The initial impact hit Uses & Requirements, Processes, and Operations. The pressure then spread to Applications (data warehouses, consolidated reporting) and Functions (quality controllers, first specialized roles).
2012–2018 (Organizational): Solvency II (2012) and the GDPR (2016/2018) made the shift organizational. Functions (CDO, DPO) and Governance were impacted first. Through diffusion, the transformation spread to Culture (awareness programs), Applications (business/IT co-construction), Operations (shared supervision), and Strategy, where data began to be treated as an asset.
2018–2025 (Technological): The industrialization of cloud native, the rise of real-time AI, and accelerated data openness triggered a technological rupture. Techniques and Operations were the first affected, before the shockwave extended to Culture, Governance, Strategy, and Applications, redesigning the enterprise around truly data-native architectures.
Each rupture followed the same logic: a triggering event first struck specific dimensions, then gradually rippled through the others. The transformation thus deployed not uniformly, but through successive domino effects that structured the overall dynamics.
Towards 2025-2030: Emerging Signals and Probable Trajectories
Four emerging signals are taking shape today and could define the next wave of enterprise data architecture transformation.
Industrialized AI-Data Convergence
Cloud platforms (AWS, Azure, GCP) began integrating native AI services into their data offerings in 2022-2023. The 2025-2030 trend points to the industrialization of these capabilities: automatic data augmentation via semantic enrichment, autonomous metadata generation, and real-time quality correction using AI models. This will primarily affect the Technical and Operational dimensions, shifting human supervision toward "human-in-the-loop" workflows where AI proposes and humans validate.
Integrated Ethics and Sovereignty
The European AI Act (2024) is a new external trigger comparable to Sarbanes-Oxley or GDPR. Its progressive application could impact the Governance dimension (e.g., emergence of Chief AI Ethics Officers), Processes (ethical algorithm validation circuits), and Culture (integrating algorithmic ethics into data literacy). This regulatory pressure may catalyze algorithmic ethics committees with internal and external stakeholders.
Generalized Technical Democratization
The convergence of generative AI and no-code/low-code interfaces is radically democratizing data analysis. Users can now query data in natural language and generate visualizations or predictive models without specialized technical skills. This trend will massively impact the Cultural dimension (generalizing data literacy) and the Functions dimension (shifting data roles toward product management and ethical supervision).
Ecosystem Interconnection and Data Marketplaces
Beyond initial data-sharing partnerships, more sophisticated infrastructures are emerging: internal data marketplaces (internal data catalogs), external data marketplaces (commercial datasets), and sectoral data spaces (e.g., European health, automotive, agriculture data spaces). Government open data is evolving into private open data ecosystems where companies selectively share data to create collective value. McKinsey (2024) estimates inter-company data exchanges could generate $1.2 trillion in additional value by 2030. This evolution will impact the Strategic dimension (redefining business models around data exchange) and the Operational dimension (systems achieving 90%+ autonomous failure resolution rates).
These emergent signals continue established patterns: accelerating intelligent automation, rising ethical/regulatory focus, democratizing access, and deepening systemic integration. Their realization will depend on the complex interplay of technical innovation, regulatory change, and organizational transformation, following the systemic logic observed over the past twenty-five years.
Conclusion: The Cross-Cutting Dynamics of a Systemic Transformation
This analysis reveals that the 25-year transformation of data architecture is not a linear evolution but a complex systemic mutation. Three major ruptures structure this evolution: the emergence of specialization (2005-2010), the constitution of an autonomous ecosystem (2012-2018), and the rise of data-native approaches (2018-2025).
Each dimension followed its own temporality, creating gaps and tensions. Technologies evolved faster than organizations, strategy sometimes outpaced operational capabilities, and new functions emerged before processes were ready to support them. These asynchronies were sources of both innovation and complexity.
The analysis also highlights the importance of system effects: the evolution of one dimension catalyzes or constrains the evolution of others. Maturing governance enables sophisticated strategies, technical empowerment permits new operational models, and the structuring of functions legitimizes new processes.
Looking beyond observed changes, this granular approach helps identify emerging tensions that will likely shape future evolution: the balance between centralization and decentralization, the interplay between automation and human expertise, the reconciliation of performance with ethics, and the arbitration between standardization and personalization.
Data has completed its metamorphosis from a technical byproduct to a strategic capital. This systemic transformation redefines the very nature of the data-driven enterprise and opens the way for new organizational models yet to be invented.
Bibliography
AFCDP. (2020). "Baromètre des DPO 2019-2020 : Deux ans après l'entrée en application du RGPD”. Association Française des Correspondants à la Protection des Données à Caractère Personnel.
Chen, H., Chiang, R. H., & Storey, V. C. (2012). "Business Intelligence and Analytics: From Big Data to Big Impact." MIS Quarterly, 36(4), 1165–1188.
Davenport, T. H., & Harris, J. G. (2017). Competing on Analytics: Updated, with a New Introduction: The New Science of Winning. Harvard Business Review Press.
Deloitte. (2022). "Future of Work in Technology: Data and Analytics." Deloitte Insights.
Duhigg, C. (2016). Smarter Faster Better: The Secrets of Being Productive. Random House.
Gartner. (2023). "Market Guide for Data and Analytics Service Providers." Gartner Research.
Gartner. (2021). Market guide for AIOps platforms. Gartner Research. https://www.gartner.com/en/documents/4006681
LaValle, S., Lesser, E., Shockley, R., Hopkins, M. S., & Kruschwitz, N. (2011). "Big Data, Analytics and the Path from Insights to Value." MIT Sloan Management Review, 52(2), 21–32.
McKinsey Global Institute. (2016). The Age of Analytics: Competing in a Data-Driven World. McKinsey & Company.
MIT Technology Review. (2021). "Building a Data-Driven Organization." MIT Technology Review Insights.
Ngando Black, C. (2024). Data Office and Chief Data Officers: The Definitive Guide. Books On Demand.
PricewaterhouseCoopers. (2004). Sarbanes-Oxley compliance costs and implementation trends: Survey results. PwC Financial Services.
Redman, T. C. (2016). Getting in Front on Data: Who Does What. Harvard Business Review Press.